
A quarterly report gives investors a structured view of a company's recent financial performance and financial position. You do not need to be an accountant to learn from it. Start with a few important questions, compare the correct periods, and look for connections between profit, cash flow, debt, and the company's main business segments.
The three financial statements
What is a quarterly report?
A quarterly report is a financial report covering a company's performance and financial position for part of the year.
It normally includes:
- An income statement
- A balance sheet
- A cash-flow statement
- Notes to the financial statements
- Management discussion and analysis
- Business-segment information
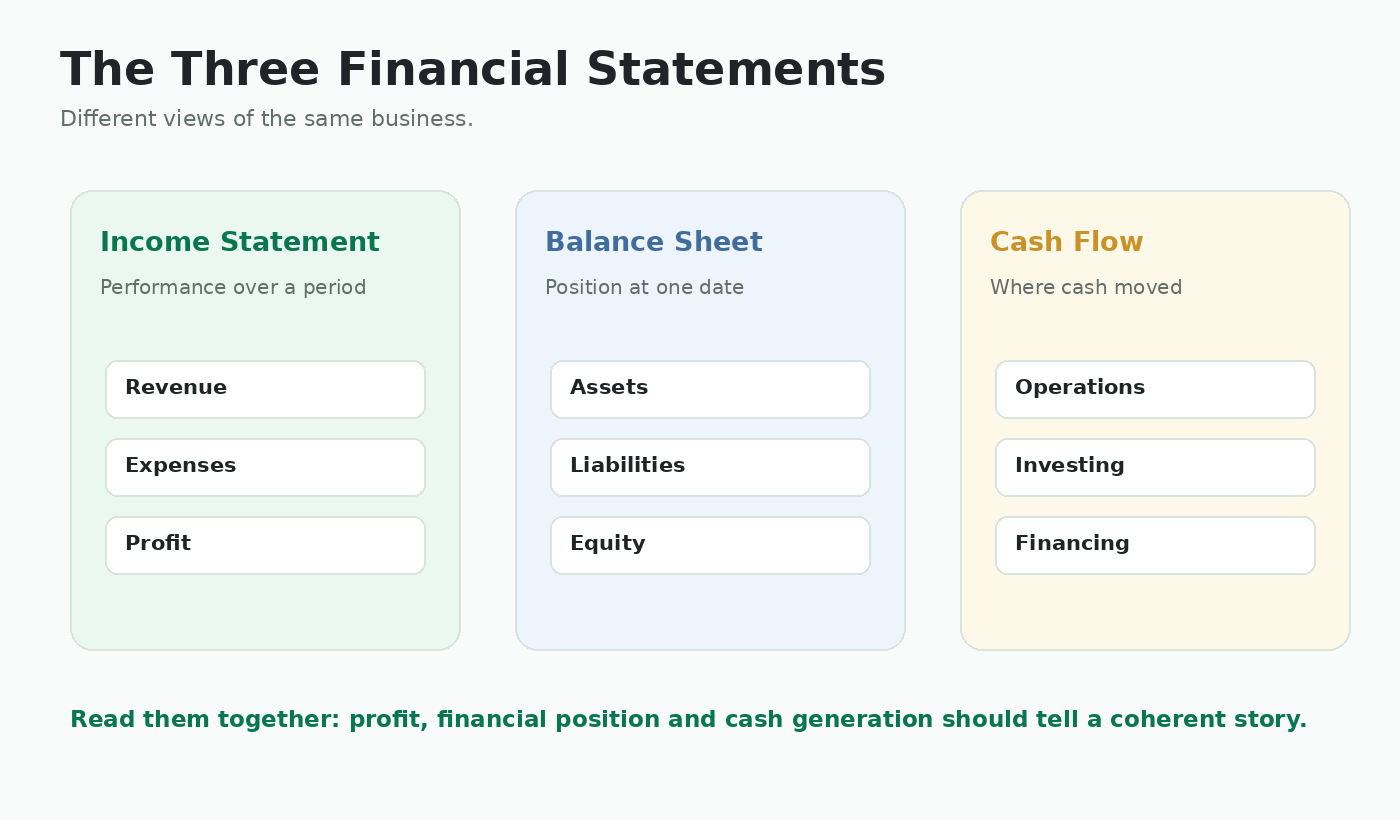
The income statement shows what the company earned and spent during the period. The balance sheet shows what the company owns and owes at a particular date. The cash-flow statement shows where cash came from and how it was used.
These statements should be read together. A company can report accounting profit while still generating weak cash flow or increasing debt.
Where should a beginner start?
Do not try to understand every line immediately.
Begin with these questions:
- Is revenue growing or declining?
- Is profit growing or declining?
- Are margins improving or weakening?
- Is operating cash flow positive?
- Is debt increasing?
- Which business segments improved or weakened?
- Were results affected by one-time items?
- What does management say caused the changes?
Once you understand the main direction of the business, you can return to the detailed notes for explanations.
Understand the reporting periods
Quarterly reports often present more than one type of period.
Three-month figure: Results for the quarter only.
Year-to-date figure: Accumulated results from the beginning of the financial year up to the reporting date.
For example, a third-quarter report may show:
- Three months ended September 30
- Nine months ended September 30
These figures should not be compared directly because they cover different lengths of time.
Useful comparisons include:
- Current quarter versus the same quarter last year
- Current year-to-date period versus the same period last year
- Current quarter versus the previous quarter, while considering seasonality
Do not compare a single quarter with a full-year figure.
First look at revenue
Revenue shows how much the company earned from selling goods or services before expenses are deducted.
Questions to ask:
- Is revenue increasing or decreasing?
- Is growth coming from the main business?
- Is the change seasonal?
- Did the company acquire another business?
- Did the company open new stores, branches, or facilities?
- Is inflation increasing sales without increasing real activity?
Simple example
Revenue increased from ₱5.0 billion to ₱5.5 billion, an increase of 10%.
The company also opened 20 new stores during the period.
A careful investor should ask whether sales at existing stores also increased or whether growth came mainly from expansion.
Understand the different profit figures
A quarterly report may contain several profit measures.
Gross profit
Gross profit is revenue remaining after the direct cost of producing goods or delivering services is deducted.
Operating income
Operating income is profit from normal business operations before interest and taxes.
Net income
Net income is the final accounting profit after operating expenses, interest, taxes, and other gains or losses.
Core or recurring income
Core or recurring income attempts to remove selected one-time or unusual items. Check how the company defines it and whether the calculation is clearly explained.
Earnings per share
Earnings per share, or EPS, shows the portion of profit attributable to each outstanding common share.
Increased revenue does not automatically mean increased profit. Costs, interest, taxes, or one-time expenses may increase faster than sales.
Revenue can rise while profit falls
Example:
- Revenue increased by 10%
- Net income decreased by 8%
Possible interpretation: The company sold more, but costs or expenses increased faster than revenue.
Possible reasons include:
- Higher raw-material costs
- Higher wages
- Increased fuel or electricity costs
- New-store or expansion expenses
- Higher interest expense
- Foreign-exchange losses
- Lower selling prices
The next step is to identify where the pressure appeared.
Check gross, operating, and net margins
Margins show how much of revenue remains after different levels of cost.
Gross margin = Gross profit ÷ Revenue
Operating margin = Operating income ÷ Revenue
Net margin = Net income ÷ Revenue
Margins help investors see where pressure is appearing.
Simple example
- Revenue increased
- Gross margin remained stable
- Operating margin declined
Possible interpretation: Direct production costs were controlled, but administrative, marketing, or other operating expenses increased.
StockBayan can later display margin comparisons directly, for example:
- Net margin this quarter: 8.4%
- Net margin in the same quarter last year: 10.1%
The company retained less profit from each peso of revenue.
Read the balance sheet
The balance sheet shows the company's financial position at a particular date.
It includes:
- Assets
- Liabilities
- Shareholders' equity
Assets are resources the company owns or controls, such as cash, receivables, inventory, property, and equipment.
Liabilities are amounts the company owes, such as supplier balances, loans, taxes, and other obligations.
Equity is the remaining interest attributable to shareholders after liabilities are deducted from assets.
Also compare current assets with current liabilities. Current items are normally expected to be collected, used, or paid within one year.
A company may be profitable but still face short-term financial pressure if large obligations are due soon and cash is limited.
Review operating cash flow
Operating cash flow shows how much cash the company generated or used through normal business operations.
This is different from net income because accounting profit includes items that may not involve immediate cash movement.
Simple example
- Net income: ₱1.0 billion
- Operating cash flow: ₱200 million
The company reported profit, but much less cash entered the business.
Possible reasons include:
- Customers have not yet paid
- Inventory increased
- Supplier balances were paid
- Other working-capital items used cash
One weak quarter does not automatically indicate a serious problem, especially in seasonal businesses. However, repeatedly weak operating cash flow compared with net income deserves attention.
Understand the three cash-flow categories
The cash-flow statement is normally divided into three sections.
Operating activities
Cash generated or used by the company's normal business operations.
Investing activities
Cash used to buy long-term assets or investments, or received from selling them.
Financing activities
Cash received from loans or share issuances, and cash used to repay debt, pay dividends, or buy back shares.
A company may have negative total cash movement because it is building a new facility, even while operating cash flow is positive.
Another company may show increased cash only because it borrowed heavily. The source of the cash matters.
Understand working capital
Working capital includes short-term operating items such as receivables, inventory, and accounts payable.
Accounts receivable
Money customers owe the company.
Inventory
Goods or materials held for sale or production.
Accounts payable
Money the company owes suppliers.
Simple example
Revenue increased by 10%, but receivables increased by 35%.
Possible interpretation: More sales may have been made on credit, or customers may be taking longer to pay.
Another example:
Inventory increased while sales declined.
Possible interpretation: Products may be selling more slowly, although inventory can also rise because the company is preparing for future demand.
Working-capital changes should be interpreted together with management's explanation and the nature of the business.
Review debt and interest expense
Debt can help a company fund expansion, projects, acquisitions, or normal operations. It also creates repayment and interest obligations.
Questions to ask:
- Is total debt increasing?
- Is debt increasing faster than revenue or profit?
- How much debt is due within one year?
- Is interest expense rising?
- Does the company generate enough operating cash flow?
- Is the borrowing funding productive growth or continuing operating losses?
- Does the company have enough cash and available credit?
Do not judge debt using one universal number. Appropriate debt levels vary between industries.
Utilities, property companies, banks, and asset-light technology businesses naturally have different financial structures.
Check capital expenditure
Capital expenditure is money spent to buy, build, improve, or maintain long-term assets.
Examples include:
- Factories
- Power plants
- Buildings
- Equipment
- Telecommunications infrastructure
- New stores
Large capital spending may support future growth, but it also uses cash and may require additional borrowing.
Ask:
- Is the spending for maintenance or expansion?
- When is the project expected to generate revenue?
- Is the project on schedule and within budget?
- How is it being funded?
Profit and available cash may move differently during periods of heavy investment.
Examine the business segments
A company may operate several different businesses. Total company results can hide weakness in one segment or strength in another.
Simple example
- Banking segment profit increased by 15%
- Property segment profit declined by 30%
- Total company profit increased by 4%
The banking segment drove the overall increase, while the property segment weakened.
Ask:
- Which segment produced most of the revenue?
- Which segment produced most of the profit?
- Which segment grew or declined?
- Are weaker segments temporary or part of a longer trend?
- Is the company becoming dependent on one business area?
Look for one-time items
One-time items can make reported profit look unusually strong or weak.
Examples include:
- Profit from selling land or a subsidiary
- Foreign-exchange gains or losses
- Insurance proceeds
- Tax benefits
- Impairments
- Restructuring costs
- Legal settlements
A large one-time gain can increase net income even when the main business did not improve.
Simple example
- Reported net income increased by 40%
- The company recorded a large gain from selling property
- Operating income from the main business declined by 5%
Possible interpretation: Reported profit increased, but the underlying business weakened.
Check earnings per share and dilution
Net income shows total profit. Earnings per share shows how much profit is attributable to each outstanding common share.
If a company issues additional shares, each existing share may represent a smaller portion of the company.
Simple example
- Net income increased by 10%
- Outstanding shares increased by 20%
- Earnings per share decreased
The company earned more total profit, but that profit was spread across a larger number of shares.
Check whether the company completed a rights offering, private placement, stock-option issuance, conversion, or other transaction that changed the share count.
Check whether the figures are audited or unaudited
Quarterly financial statements are often unaudited, while annual financial statements are normally audited.
Also look for references to:
- Reviewed figures
- Restated figures
- Reclassified amounts
- Changes in accounting policies
- Corrections of prior-period information
A restatement means previously reported figures were changed. A reclassification may move an amount between categories without changing total profit or total assets.
Read the notes when the current report does not match numbers you remember from an earlier report.
Read management's explanation
Management discussion can help explain:
- Why revenue changed
- Why costs increased or decreased
- Which business segments improved or weakened
- Why cash flow differed from profit
- Why debt increased
- What projects are underway
- What risks may affect future quarters
Management comments are useful, but they naturally represent the company's perspective.
Compare the explanation with the numbers.
If management describes strong performance while margins, cash flow, or debt are worsening, investigate the difference.
Warning signs that deserve more investigation
The following are not automatic proof that a company is in trouble, but they deserve closer attention:
- Profit rising mainly because of a one-time gain
- Operating cash flow repeatedly below net income
- Receivables rising much faster than sales
- Inventory rising while sales weaken
- Short-term debt increasing sharply
- Interest expense rising faster than operating income
- Frequent adjusted or core profit measures without clear explanation
- Large related-party balances
- Repeated project delays
- Management explanations that do not match the financial figures
One unusual quarter may have a reasonable explanation. Repeated patterns are usually more important than a single period.
Worked example: Reading the full picture
Imagine a fictional company reports the following:
| Metric | Current quarter | Same quarter last year |
|---|---|---|
| Revenue | ₱5.5 billion | ₱5.0 billion |
| Gross profit | ₱1.65 billion | ₱1.60 billion |
| Operating income | ₱700 million | ₱750 million |
| Net income | ₱480 million | ₱520 million |
| Operating cash flow | ₱220 million | ₱600 million |
| Total debt | ₱8.0 billion | ₱6.5 billion |
Step 1: Revenue
Revenue increased by 10%.
Step 2: Gross profit
Gross profit increased only slightly, which suggests gross margin weakened.
Step 3: Operating income
Operating income declined, meaning operating expenses increased faster than gross profit.
Step 4: Net income
Net income declined despite higher revenue.
Step 5: Cash flow
Operating cash flow fell sharply and was much lower than net income.
Step 6: Debt
Total debt increased by ₱1.5 billion.
Possible interpretation: The company grew sales, but profitability, cash conversion, and debt all weakened. The next step is to review working capital, interest expense, expansion spending, and management's explanation.
Quarterly report checklist
- □ Am I comparing the correct periods?
- □ Is revenue growing?
- □ Is profit growing?
- □ Are gross, operating, and net margins improving?
- □ Is operating cash flow positive?
- □ Is operating cash flow reasonably consistent with net income?
- □ Are receivables or inventory rising unusually fast?
- □ Is debt manageable?
- □ Is interest expense increasing?
- □ Is capital expenditure supporting growth or using too much cash?
- □ Which business segments improved or weakened?
- □ Were results affected by one-time items?
- □ Did the number of outstanding shares change?
- □ Are the figures audited, unaudited, restated, or reclassified?
- □ Does management's explanation match the numbers?
- □ What should investors watch next quarter?
Read the statements together
No single number tells the whole story.
Revenue may grow while margins weaken. Net income may rise because of a one-time gain. Profit may be positive while operating cash flow is weak. Cash may increase because the company borrowed more money.
A good quarterly-report review connects:
- Revenue
- Profit
- Margins
- Cash flow
- Working capital
- Debt
- Capital expenditure
- Business segments
- Earnings per share
- Management explanation
The goal is not to understand every accounting detail immediately. The goal is to identify what improved, what weakened, and what evidence to watch in the next report.