
A stock may appear cheap because its price is low or its valuation ratios are below those of other companies. But a low valuation can also reflect weak earnings, high debt, declining growth, or serious business risks. The goal is not simply to find the lowest number. It is to understand what investors are paying for and why the stock is valued that way.
Price is not the same as value
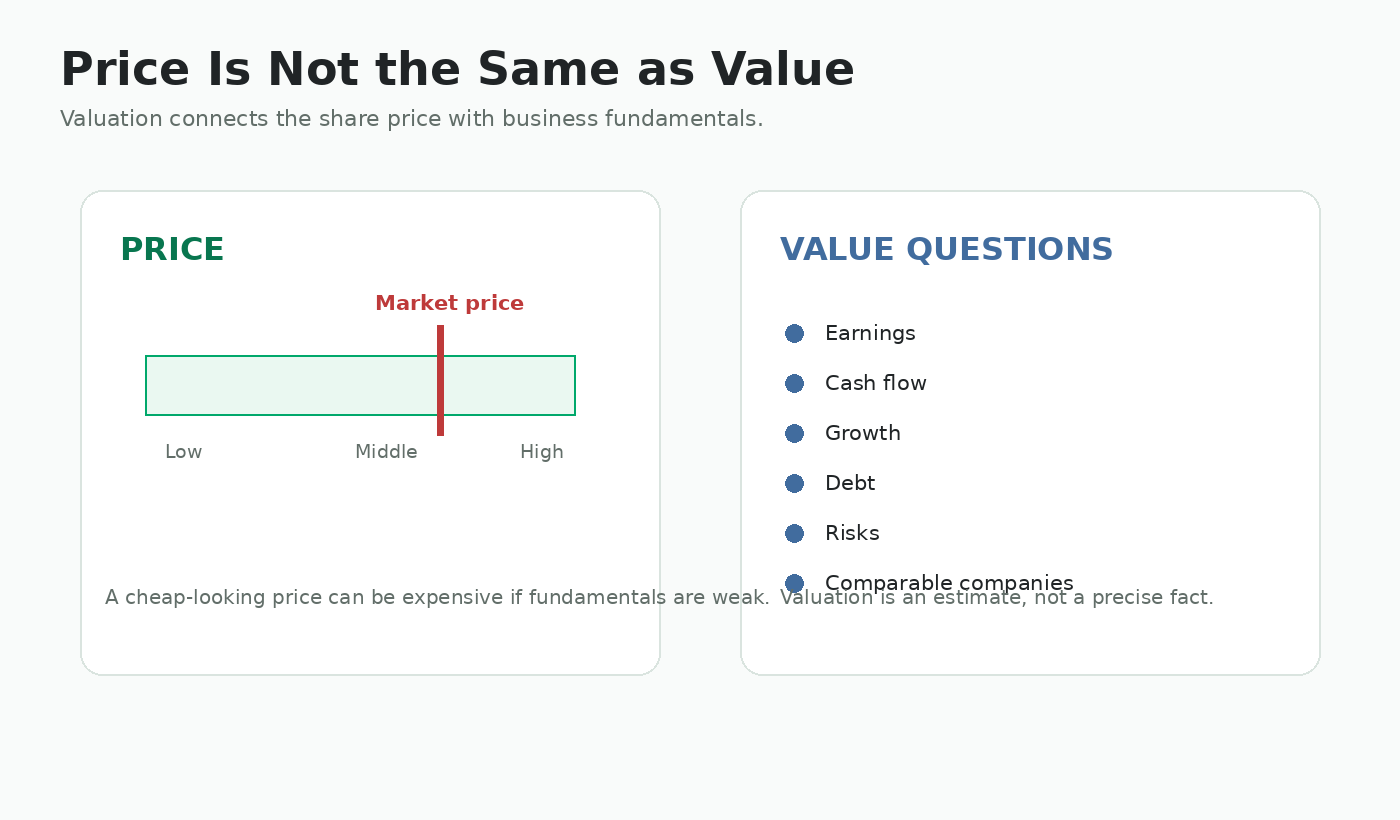
What does “cheap” really mean?
A stock is not cheap simply because its share price is low.
A ₱2 share can be more expensive than a ₱1,000 share when the company's earnings, assets, debt, growth, and number of outstanding shares are considered.
In investing, “cheap” normally means that the market price appears low compared with the value or financial performance of the business.
That comparison may involve:
- Earnings
- Book value
- Cash flow
- Dividends
- Growth
- Debt
- Business quality
- Risks
No single ratio can prove that a stock is undervalued.
Share price and market capitalization
Share price tells you the price of one share. It does not tell you the total value the market places on the company.
Market capitalization = Share price × Outstanding shares
Simple example
Company A has a share price of ₱10 and 10 billion outstanding shares.
Market capitalization: ₱100 billion
Company B has a share price of ₱500 and 100 million outstanding shares.
Market capitalization: ₱50 billion
Company B has the higher share price but the lower total market value.
This is why investors should not compare companies using share price alone.
Understand the P/E ratio
The price-to-earnings ratio, or P/E ratio, compares the share price with earnings per share.
P/E ratio = Share price ÷ Earnings per share
Simple example
- Share price: ₱30
- Annual earnings per share: ₱3
P/E ratio: ₱30 ÷ ₱3 = 10
This means investors are paying approximately ₱10 for each ₱1 of annual earnings represented by one share.
A lower P/E may indicate a lower valuation, but it may also reflect lower expected growth or higher risk.
When the P/E ratio can mislead
P/E is useful, but it has important limitations.
- A company with negative earnings does not have a meaningful normal P/E ratio.
- A one-time gain can make earnings look unusually high and the P/E unusually low.
- A cyclical company may look cheapest when earnings are temporarily near their peak.
- Different industries normally trade at different valuation levels.
- A low P/E may reflect expected decline, weak governance, high debt, or other risks.
- Past earnings may not represent future earnings.
Always check whether the earnings used in the calculation come from normal, recurring operations.
Trailing and forward P/E
A P/E ratio can be calculated using different earnings figures.
Trailing P/E
Uses earnings already reported, often covering the most recent twelve months.
Forward P/E
Uses estimated future earnings.
Trailing P/E is based on actual reported results, but those results may no longer represent current conditions.
Forward P/E may be more relevant to future performance, but it depends on forecasts that can be wrong.
When comparing P/E ratios, verify that the same type of earnings period is being used.
Understand the price-to-book ratio
The price-to-book ratio, or P/B ratio, compares the share price with book value per share.
P/B ratio = Share price ÷ Book value per share
Book value is broadly the accounting value remaining for shareholders after liabilities are deducted from assets.
Simple example
- Share price: ₱24
- Book value per share: ₱20
P/B ratio: 1.2
The market price is 1.2 times the reported book value per share.
P/B can be useful for banks, property companies, and other asset-heavy businesses. It may be less useful for companies whose value comes mainly from brands, software, customer relationships, or intellectual property.
Below book value does not automatically mean a bargain
A company trading below book value may deserve attention, but the discount may have a reason.
Possible concerns include:
- Assets that produce weak returns
- Property or investments recorded above their realistic value
- Large doubtful receivables
- Inventory that may be difficult to sell
- High liabilities
- Continuing losses
- Governance concerns
- Assets that are difficult to convert into cash
Book value is an accounting measure. It does not guarantee that shareholders could receive the same amount if the company sold its assets.
Use dividend yield carefully
Dividend yield compares annual dividends per share with the current share price.
Dividend yield = Annual dividend per share ÷ Share price
Simple example
- Annual dividend per share: ₱2
- Share price: ₱40
Dividend yield: 5%
A high yield may indicate an attractive income opportunity, but it may also mean:
- The share price has fallen sharply
- The dividend included a special payment
- The market expects the dividend to be reduced
- Profit or cash flow is weakening
Use the dividend guide to review the payment's sustainability and important dates.
Consider earnings growth
A valuation ratio should be considered together with the direction and quality of earnings.
A company with a P/E of 20 may be more attractive than a company with a P/E of 8 when the first company is growing reliably and the second company's earnings are declining.
Ask:
- Are revenue and earnings growing?
- Is growth recurring or caused by a one-time gain?
- Is earnings per share growing as well as total profit?
- Is growth supported by operating cash flow?
- Is the company issuing additional shares?
- Can the company continue growing without taking excessive debt?
Do not pay for expected growth without considering whether the company can realistically deliver it.
Check the quality of earnings per share
Earnings per share, or EPS, is often used in the P/E calculation.
EPS can rise because:
- The company earned more from normal operations
- A one-time gain increased net income
- The number of outstanding shares decreased
- Accounting or tax items changed
EPS can grow more slowly than total profit when the company issues additional shares.
Simple example
- Total profit increased by 10%
- Outstanding shares increased by 20%
- EPS declined
Investors own shares, so per-share results are often more useful than total company growth alone.
Check whether earnings produce cash
A low P/E is less convincing when reported earnings repeatedly fail to produce operating cash flow.
Compare:
- Net income
- Operating cash flow
- Receivables
- Inventory
- Capital expenditure
Simple example
- Net income: ₱1 billion
- Operating cash flow: ₱150 million
The company reported substantial profit, but much less cash entered the business.
There may be a reasonable explanation, such as seasonality or temporary working-capital changes. Repeated weak cash conversion deserves closer investigation.
Cheap earnings are not necessarily valuable earnings if they do not produce cash.
Understand free cash flow
Free cash flow is a practical way to consider cash remaining after the company funds necessary capital spending.
A simple version is:
Free cash flow = Operating cash flow − Capital expenditure
Free cash flow can be used for:
- Debt repayment
- Dividends
- Share buybacks
- Acquisitions
- Additional investment
Not all capital expenditure is the same. Some maintains current operations, while some supports future growth.
A negative free-cash-flow period is not automatically bad when the company is investing in valuable projects. The purpose, funding, and expected return of the spending matter.
Do not ignore debt
A company may appear inexpensive because shareholders are taking substantial financial risk.
Review:
- Total debt
- Cash balance
- Short-term debt
- Interest expense
- Operating cash flow
- Debt maturity dates
- Loan conditions
A low P/E company with heavy debt may be more vulnerable when interest rates rise, earnings decline, or loans need refinancing.
Debt should also be judged according to the industry. Banks, utilities, property companies, and asset-light businesses have different financial structures.
Consider return on equity
Return on equity, or ROE, compares profit with shareholders' equity.
ROE = Net income ÷ Average shareholders' equity
It helps show how effectively a company uses shareholder capital to generate profit.
Simple example
- Net income: ₱1 billion
- Average shareholders' equity: ₱10 billion
ROE: 10%
A company trading near book value while producing strong and sustainable returns may deserve a different valuation from a company with weak returns on its assets.
High ROE can also be increased by heavy debt or unusually low equity, so it should not be used alone.
Compare similar companies
Valuation ratios are most useful when comparing businesses with similar economics.
Avoid directly comparing:
- A bank with a property developer
- A regulated utility with a retailer
- A mature dividend company with a fast-growing business
- An asset-heavy manufacturer with a software company
Compare companies with:
- The same or similar sector
- Similar business models
- Similar growth rates
- Similar debt levels
- Similar profitability
- Similar risk
The lowest P/E in the entire market is not automatically the best comparison.
Compare the company with its own history
A company trading below its normal historical valuation may deserve attention.
However, the business may have changed.
Ask:
- Are earnings weaker than before?
- Has growth slowed?
- Is debt higher?
- Did the number of outstanding shares increase?
- Has the industry become more competitive?
- Did regulations or economic conditions change?
- Was the previous valuation unusually high?
A lower historical valuation may represent an opportunity, or it may reflect a genuine decline in business quality.
Be careful with cyclical companies
Cyclical companies can experience large changes in revenue and profit as commodity prices, construction activity, interest rates, shipping demand, or economic conditions change.
A cyclical company may appear to have a very low P/E when earnings are temporarily near their highest level.
If conditions weaken, earnings may fall and the apparent low valuation can disappear.
For cyclical businesses, review:
- Several years of earnings
- Margins across the cycle
- Debt
- Cash generated during strong periods
- How management prepares for weaker periods
Do not assume the most recent strong quarter will continue indefinitely.
Understand value traps
A value trap is a stock that appears cheap but remains cheap or becomes cheaper because the business continues to deteriorate.
Possible warning signs include:
- Declining revenue
- Repeated profit declines
- Weak operating cash flow
- Rising debt
- Dividend reductions
- Loss of important customers
- Large share dilution
- Governance concerns
- Obsolete products or assets
- Temporary earnings being treated as normal
A low valuation is useful only when the business can stabilize, improve, or continue producing value for shareholders.
Business quality still matters
Two companies with similar valuation ratios may deserve different valuations.
Consider:
- Competitive position
- Management quality
- Corporate governance
- Customer concentration
- Recurring revenue
- Pricing power
- Financial strength
- Long-term demand
- Industry risks
A strong business is not automatically a good investment at any price. A weak business is not automatically attractive because its valuation is low.
Price and quality should be considered together.
Worked example: The lowest ratio is not always cheapest
Imagine two fictional companies:
| Metric | Company A | Company B |
|---|---|---|
| Share price | ₱40 | ₱12 |
| P/E ratio | 12 | 6 |
| Earnings growth | 8% | −20% |
| Operating cash flow | Strong | Weak |
| Debt | Moderate | High |
| Dividend yield | 4% | 9% |
Company B appears cheaper because it has the lower share price, lower P/E, and higher dividend yield.
However, Company B also has declining earnings, weak cash flow, and high debt. Its dividend may be difficult to maintain.
Company A has the higher valuation, but it also has growing earnings, stronger cash flow, and lower financial risk.
This example does not prove that Company A is the better investment. It shows why the cheapest ratio is not always the cheapest business.
A simple valuation process
A beginner can use the following order:
- Understand what the company does.
- Check whether revenue and earnings are stable or growing.
- Remove the effect of obvious one-time gains or losses.
- Review operating cash flow.
- Check debt and interest expense.
- Review earnings per share and dilution.
- Calculate or review P/E, P/B, and dividend yield.
- Compare the company with similar businesses.
- Compare the valuation with the company's own history.
- Identify risks that may explain the low valuation.
The ratios should confirm your understanding of the business, not replace it.
Stock valuation checklist
- □ Do I understand how the company earns money?
- □ Is the company profitable?
- □ Are the earnings recurring?
- □ Is earnings per share growing?
- □ Does operating cash flow support reported profit?
- □ Is debt manageable?
- □ Is the P/E based on normal earnings?
- □ Is book value meaningful for this type of business?
- □ Is the dividend sustainable?
- □ How does the valuation compare with similar companies?
- □ How does it compare with the company's own history?
- □ What risks might explain the low valuation?
- □ Could this be a cyclical peak or a value trap?
- □ Have I checked the latest official financial report?
Use valuation as a starting point, not a verdict
Valuation ratios help investors ask better questions. They do not provide a guaranteed answer.
A stock can have a low P/E because it is overlooked, but it can also have a low P/E because earnings are expected to decline.
A high-quality company can be a poor investment when the price is too high. A weak company can remain a poor investment even when the ratios look low.
Look at price together with earnings quality, cash flow, debt, growth, business quality, and risk.
The goal is not to find the lowest number. The goal is to understand what you are paying for.