
The first 15 minutes after the market opens can be fast and noisy. Instead of predicting direction immediately, the opening-range approach waits for the market to establish a high and a low.
Those levels become reference points for a possible breakout later in the session.
See the first 15-minute setup
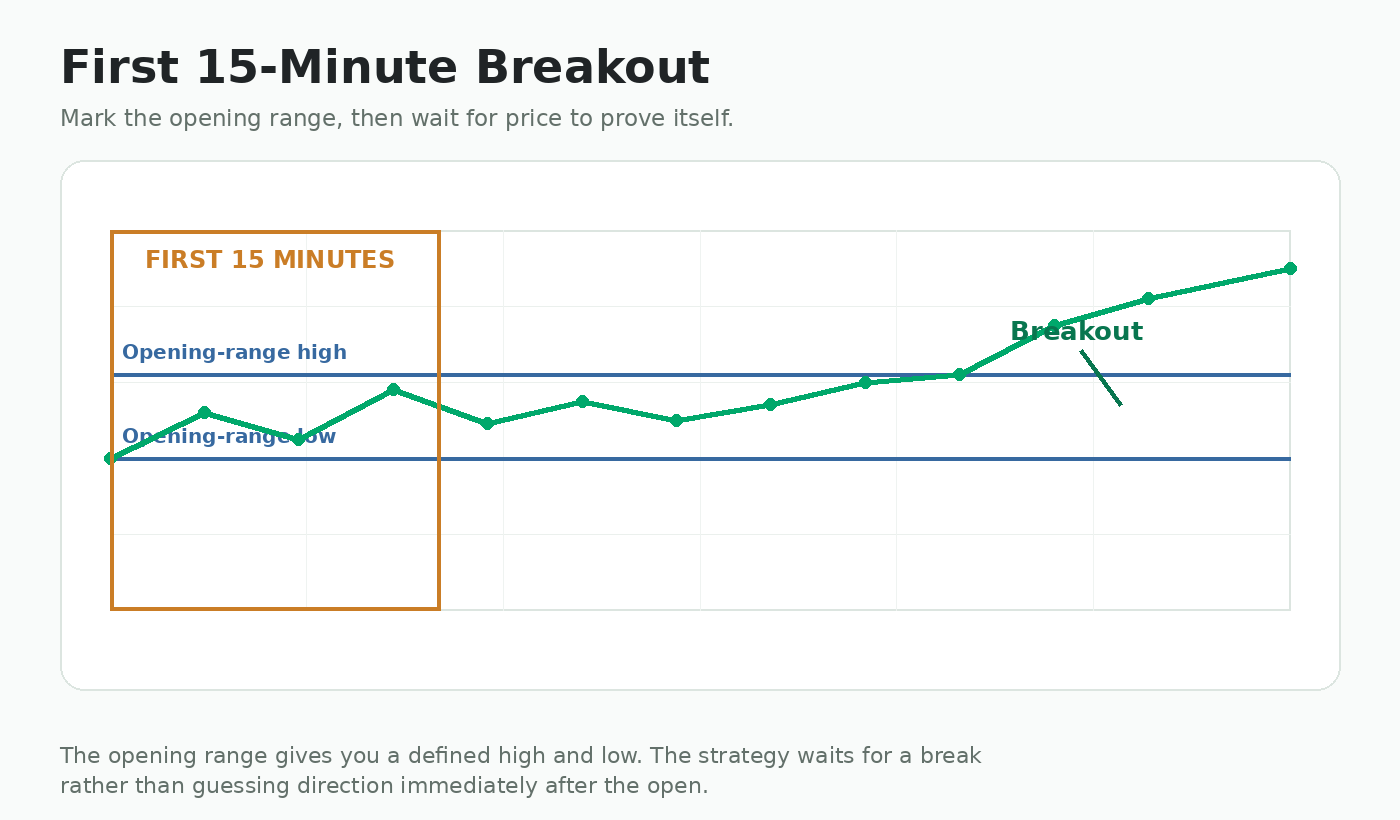
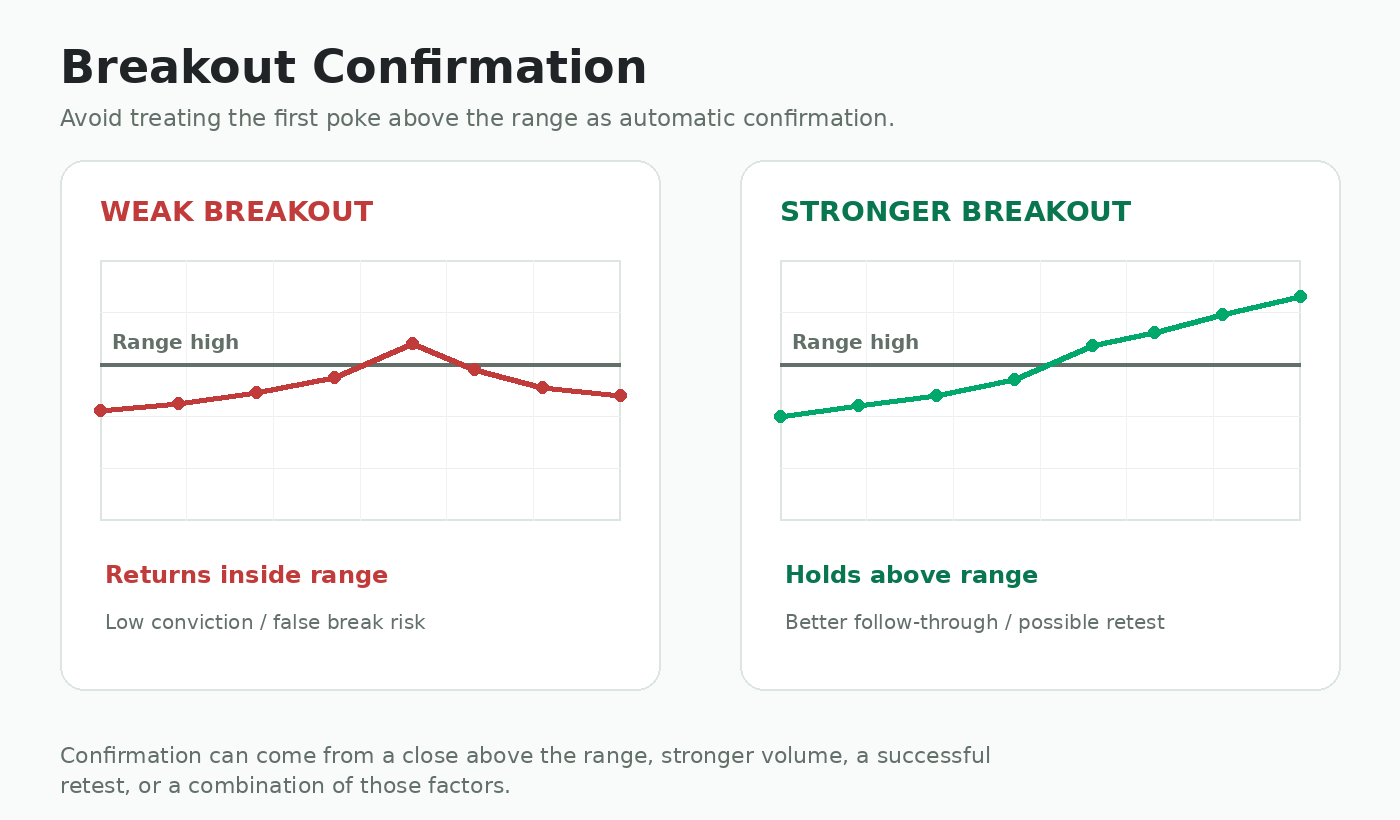
These visuals show how to mark the opening range and why confirmation matters before treating a move as a real breakout.
What is the first 15-minute breakout?
The first 15-minute breakout is an opening-range strategy. You observe the first 15 minutes of trading, mark the highest and lowest prices reached during that period, then watch what happens when price approaches or breaks those boundaries.
The purpose is to let the market establish an initial range instead of guessing direction immediately after the open.
Why the opening range matters
The market open can contain overnight orders, reactions to news and fast price discovery. The first few minutes can therefore be noisy.
Waiting for an opening range gives you two useful reference points:
The basic setup
What counts as confirmation?
There is no single mandatory confirmation method. Traders may look for one or more of the following:
- A candle closing beyond the opening-range boundary.
- Volume expanding as price breaks the level.
- Price holding above the range after the breakout.
- A retest of the range high followed by renewed buying.
- A clean order book and enough liquidity to enter without excessive slippage.
More confirmation can reduce false entries, but waiting longer can also mean entering at a less favorable price.
Filters that can improve the setup
Not every opening-range breakout is equally interesting. Useful filters can include:
- A clear catalyst or meaningful company disclosure.
- Unusually strong early volume.
- A stock already showing relative strength.
- A breakout aligned with the larger intraday or daily trend.
- Enough liquidity and a manageable bid-ask spread.
Risk plan for the opening-range trade
Possible invalidation levels might include a move back inside the opening range, failure of a retest, or a break of a nearby swing low. The correct level depends on the exact setup.
What matters is that the invalidation level is chosen before entry so position size can be calculated from the actual stop distance.
Common opening-range breakout mistakes
- Entering before the first 15 minutes are complete.
- Buying the first move above the high without checking volume or follow-through.
- Chasing after price has already moved far beyond the opening range.
- Ignoring nearby daily resistance.
- Trading an illiquid stock where the breakout cannot be entered or exited efficiently.
- Assuming every opening-range breakout should be traded.