
Support, resistance and trend structure are among the most useful ways to organize a chart. They help you understand where buyers or sellers have previously become active and whether price is generally moving higher, lower or sideways.
The goal is not to predict an exact turning point. It is to identify important areas, then watch how price behaves when it reaches them.
See price structure more clearly
These diagrams make it easier to recognize support and resistance zones, breakout retests, and the difference between an uptrend and a downtrend.

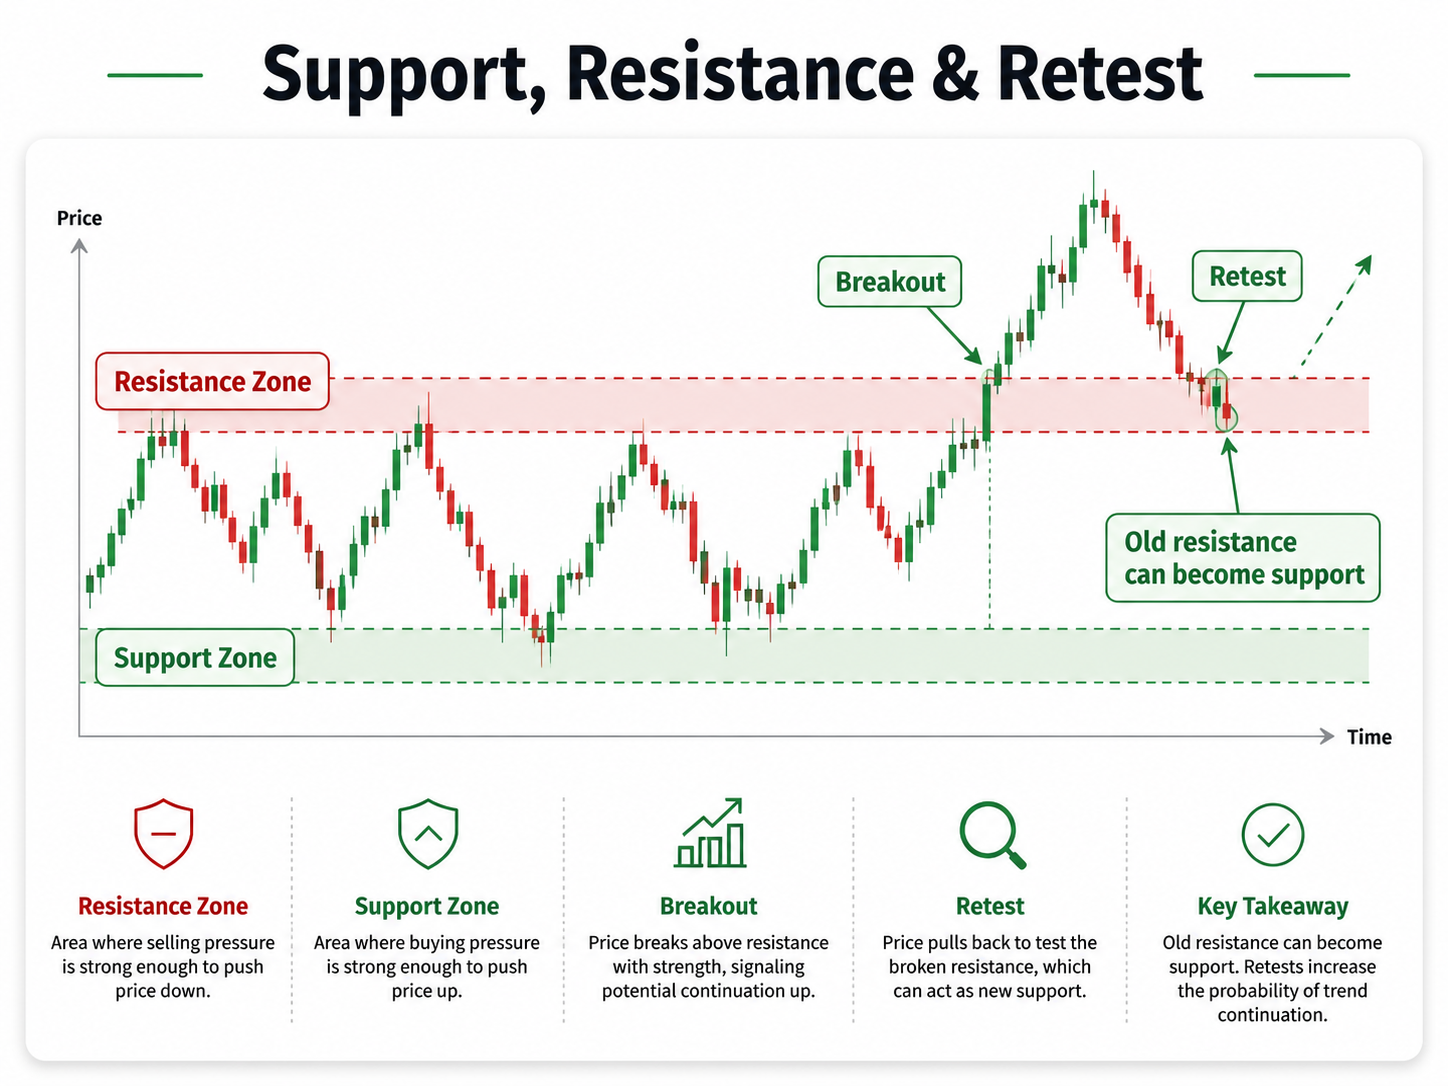
What is support?
Support is a price area where buying interest has previously been strong enough to slow, stop or reverse a decline.
It does not mean the price must bounce every time. Support simply tells you that the area has mattered before.
What is resistance?
Resistance is a price area where selling pressure has previously been strong enough to slow, stop or reverse an advance.
Like support, resistance is not a guarantee that price will turn. It is an area worth watching because sellers have previously become active there.
Support and resistance can switch roles
A useful chart concept is that an old resistance area can sometimes become support after price breaks above it. The opposite can also happen: broken support can later act as resistance.
This is one reason traders often watch for a retest after a breakout.
How to read an uptrend
An uptrend is more than a stock simply moving higher. Traders usually look for a sequence of rising swing highs and rising swing lows.
A healthy uptrend often looks like:
When that structure starts to fail, the trend may be weakening.
How to read a downtrend
A downtrend normally shows the opposite structure: lower highs and lower lows.
A single bullish candle inside a downtrend does not automatically mean the downtrend has ended. Look for a meaningful change in the overall structure.
Sideways markets and consolidation
Not every chart is trending. Sometimes price moves between support and resistance without making meaningful progress in either direction.
This is often called a range or consolidation.
- Buyers may become active near the lower part of the range.
- Sellers may become active near the upper part.
- Movement in the middle can be noisy and less useful.
- A future breakout may become more important if the range has lasted for a long time.
Do not force a trend interpretation onto a chart that is clearly moving sideways.
Breakouts and false breakouts
A breakout happens when price moves through an important support or resistance area. But not every breakout continues.
Useful things to watch around a breakout include:
- Does price close beyond the level?
- Is volume stronger than normal?
- Does the move have enough liquidity?
- Does price hold above the level on a retest?
Common mistakes with support and resistance
- Drawing too many levels until the chart becomes impossible to read.
- Treating every level as an exact price rather than an area.
- Assuming support must hold because it held before.
- Buying immediately at resistance because the stock is moving fast.
- Ignoring volume and liquidity around a breakout.
- Forgetting that higher timeframes can contain more important levels.
Good levels should simplify the chart, not make it more complicated.