
Volume and liquidity answer two different but closely related questions. Volume tells you how much trading activity is taking place. Liquidity tells you how easily you can enter or exit without moving the price too much.
A strong chart setup is more useful when it can also be traded efficiently. That is why volume and liquidity should always be read together with price.
See how volume and liquidity work together
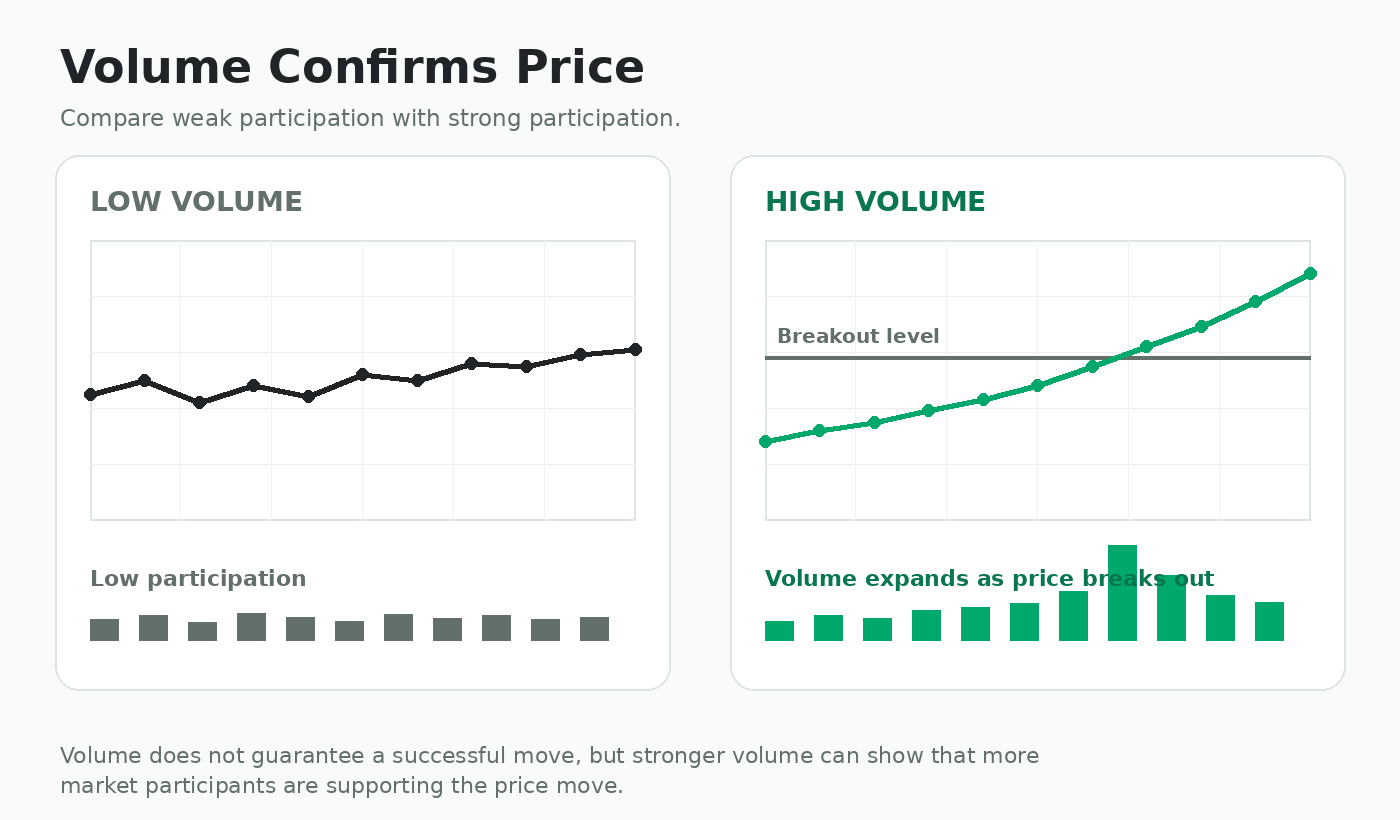
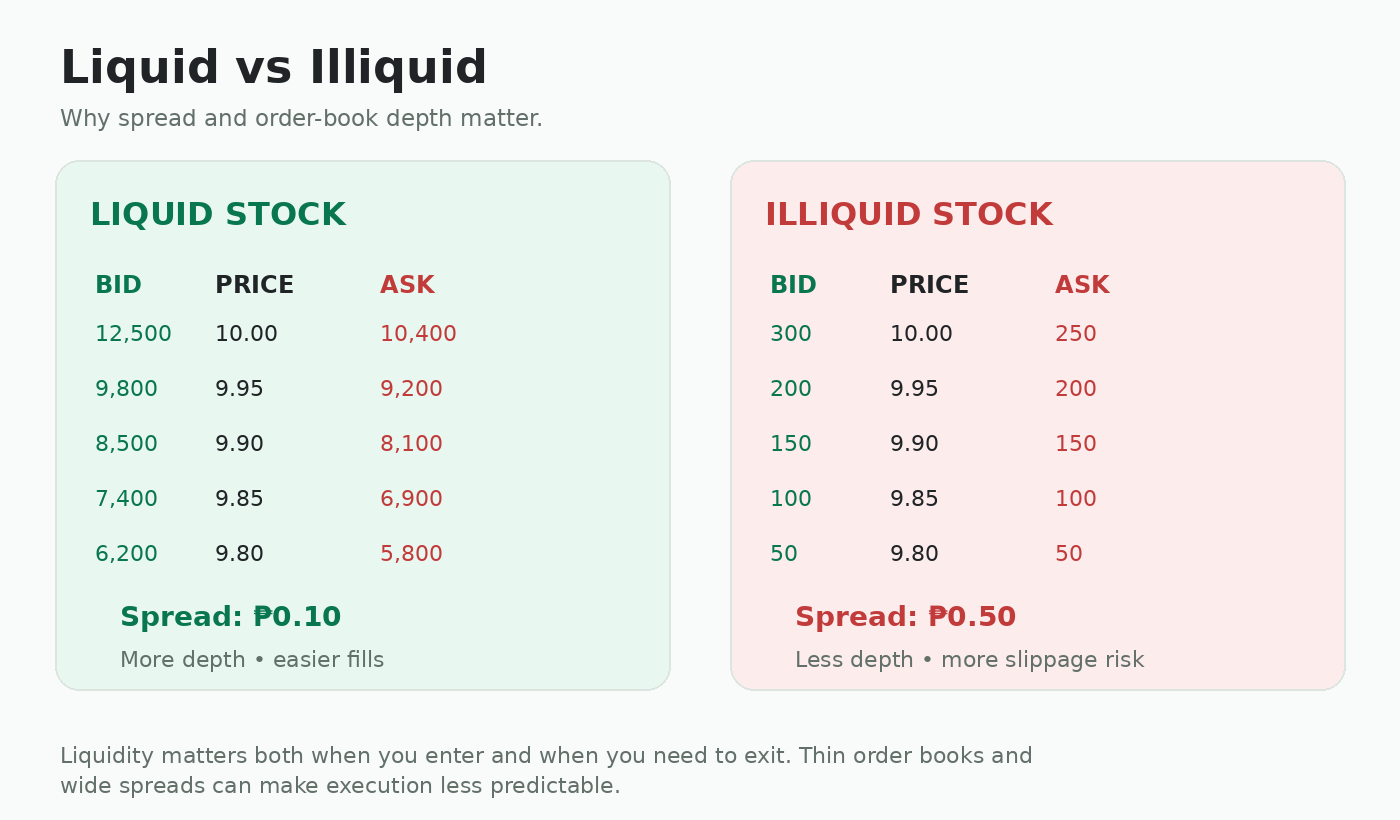
These diagrams show how volume can help confirm a price move and why liquid stocks with tight spreads and deeper order books are generally easier to trade.
What is volume?
Volume is the number of shares traded during a specific period. It tells you how much trading activity is taking place behind a price move.
Volume does not tell you whether price must rise or fall. It tells you how much activity is supporting the move you are watching.
How volume can confirm price
Price tells you where the market is moving. Volume can help you judge how much participation is behind that move.
Compare volume with what is normal
A volume number is much more useful when compared with the stock's normal activity.
- Compare the current candle with recent candles on the same timeframe.
- Compare today's volume with the stock's normal daily trading activity.
- Watch for sudden expansion around breakouts, reversals or company news.
- Remember that naturally active stocks can trade millions of shares without anything unusual happening.
The question is not simply “Is volume high?” It is “Is volume unusually strong for this stock and this situation?”
What is liquidity?
Liquidity describes how easily shares can be bought or sold without causing a large change in price.
A chart can look attractive while the stock itself is difficult to trade. That is why liquidity should be checked before entry, not after you need to exit.
Bid-ask spread and order-book depth
Two practical signs of liquidity are the bid-ask spread and the amount of shares available near the current market price.
- Tight spread: The best bid and ask are close together.
- Wide spread: There is a larger difference between what buyers offer and sellers ask.
- Deep order book: More shares are available across nearby price levels.
- Thin order book: Relatively small orders may move through several price levels.
Wide spreads and thin depth can increase slippage, especially when entering or exiting quickly.
Using volume and liquidity together
A strong trading setup normally becomes easier to execute when price, volume and liquidity support the same idea.
Common volume and liquidity mistakes
- Buying a breakout because price moved, without checking whether volume increased.
- Assuming high volume automatically means the price will continue higher.
- Ignoring a wide spread in a stock that looks good on the chart.
- Using a position size that is too large compared with normal trading activity.
- Looking only at today's total volume instead of where the volume appeared.
- Forgetting that liquidity can disappear quickly during volatile market conditions.