
A candlestick chart compresses a large amount of price information into a simple visual form. Each candle tells you where price started, how high and low it travelled, and where it finished during one chosen period.
The important skill is not memorizing dozens of candle names. It is learning to read what buyers and sellers actually did, where it happened, and what happened immediately before and after.
See what the candlestick terms mean
A few simple diagrams make candlestick reading much easier than text alone. These illustrations show the key parts of a candle, the difference between bullish and bearish candles, common shapes, and how sequences can tell a better story than one isolated candle.
What one candlestick represents
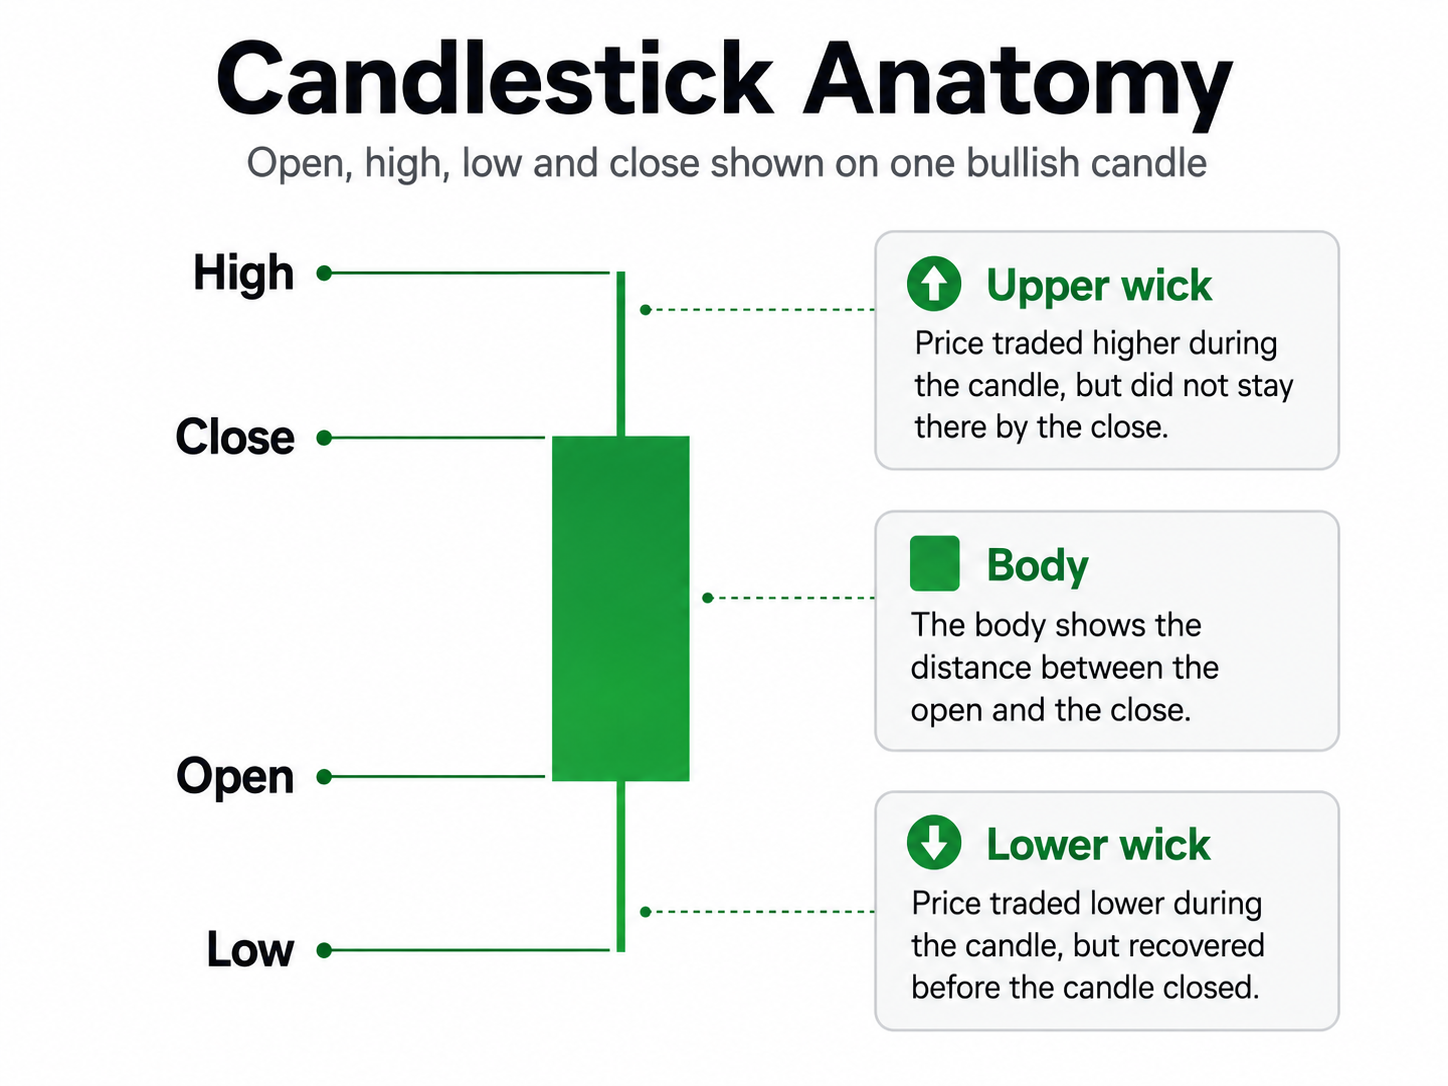
Every candlestick represents four prices for one specific timeframe:
Together these are often called OHLC: Open, High, Low and Close.
A candle does not tell you every trade that happened inside the period. It gives you a compact summary of where price started, the extremes it reached, and where it finished.
The anatomy of a candlestick
The body is the distance between the open and close.
The upper wick shows how far price traded above the body.
The lower wick shows how far price traded below the body.
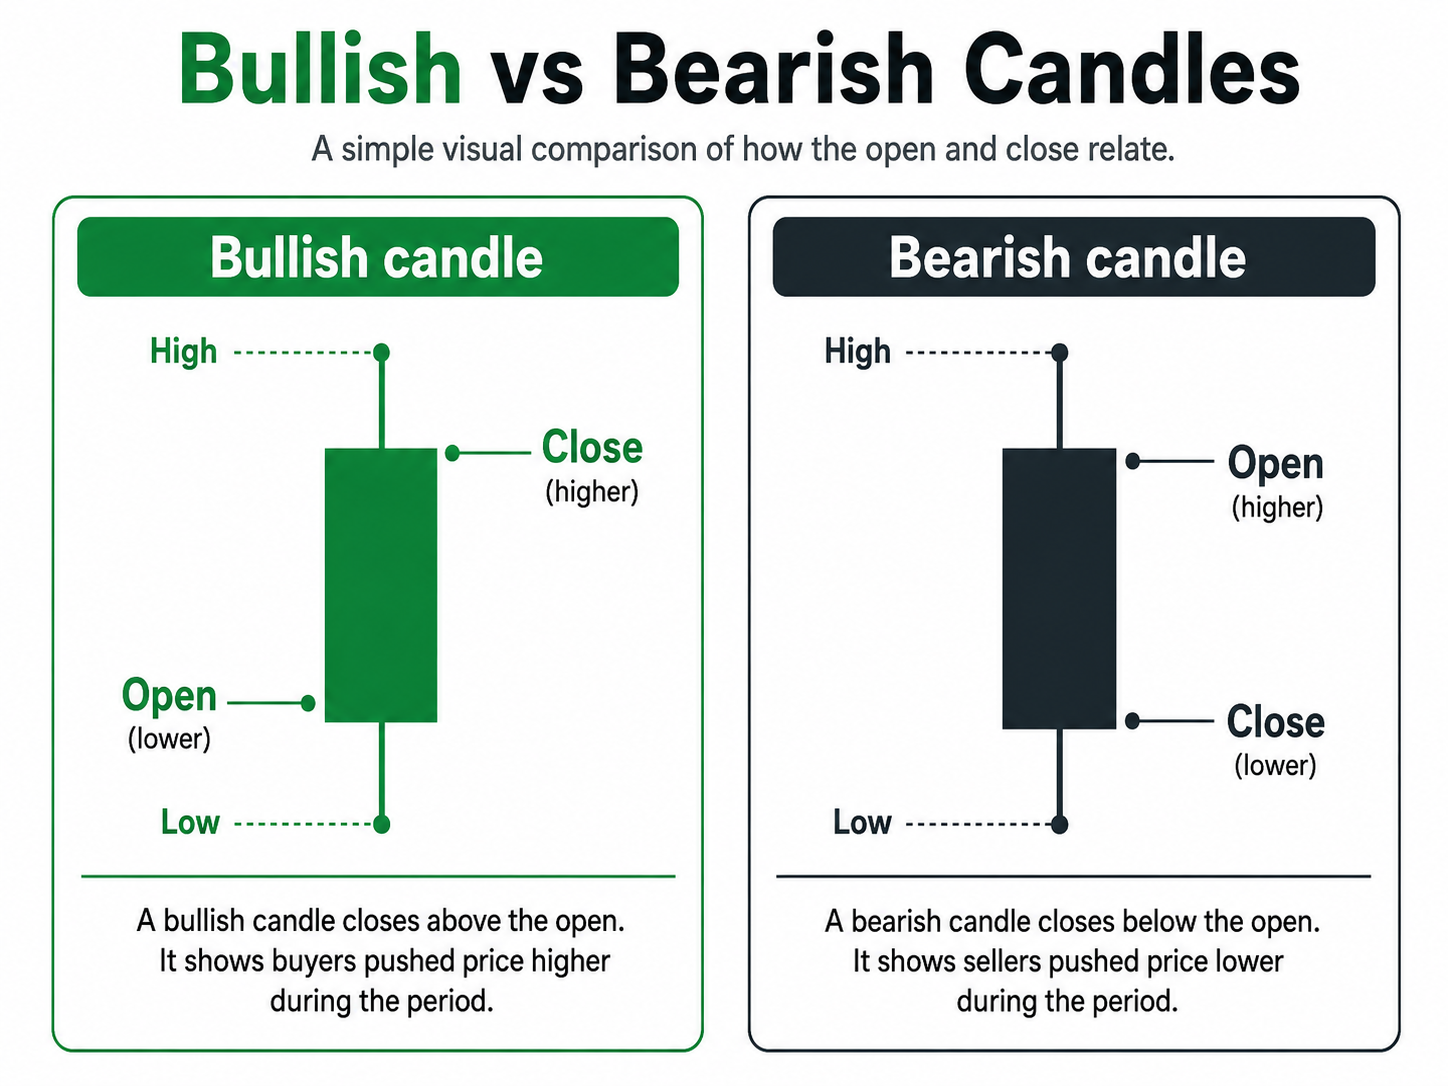
On StockBayan examples, green candles normally represent a close above the open. Dark candles represent a close below the open.
The body tells you where the period opened and closed. The wicks tell you where price travelled but did not remain by the end of the candle.
Bullish and bearish candles
The close is above the open. Buyers were able to finish the period at a higher price than where it began.
The close is below the open. Sellers were able to finish the period at a lower price than where it began.
A bullish candle is not automatically a buy signal, and a bearish candle is not automatically a sell signal. A single candle is only one piece of information.
What body size and wicks can tell you
A candle becomes more useful when you compare its body and wicks with the candles around it.
- Long body: price moved substantially from open to close. This can show strong directional pressure during that period.
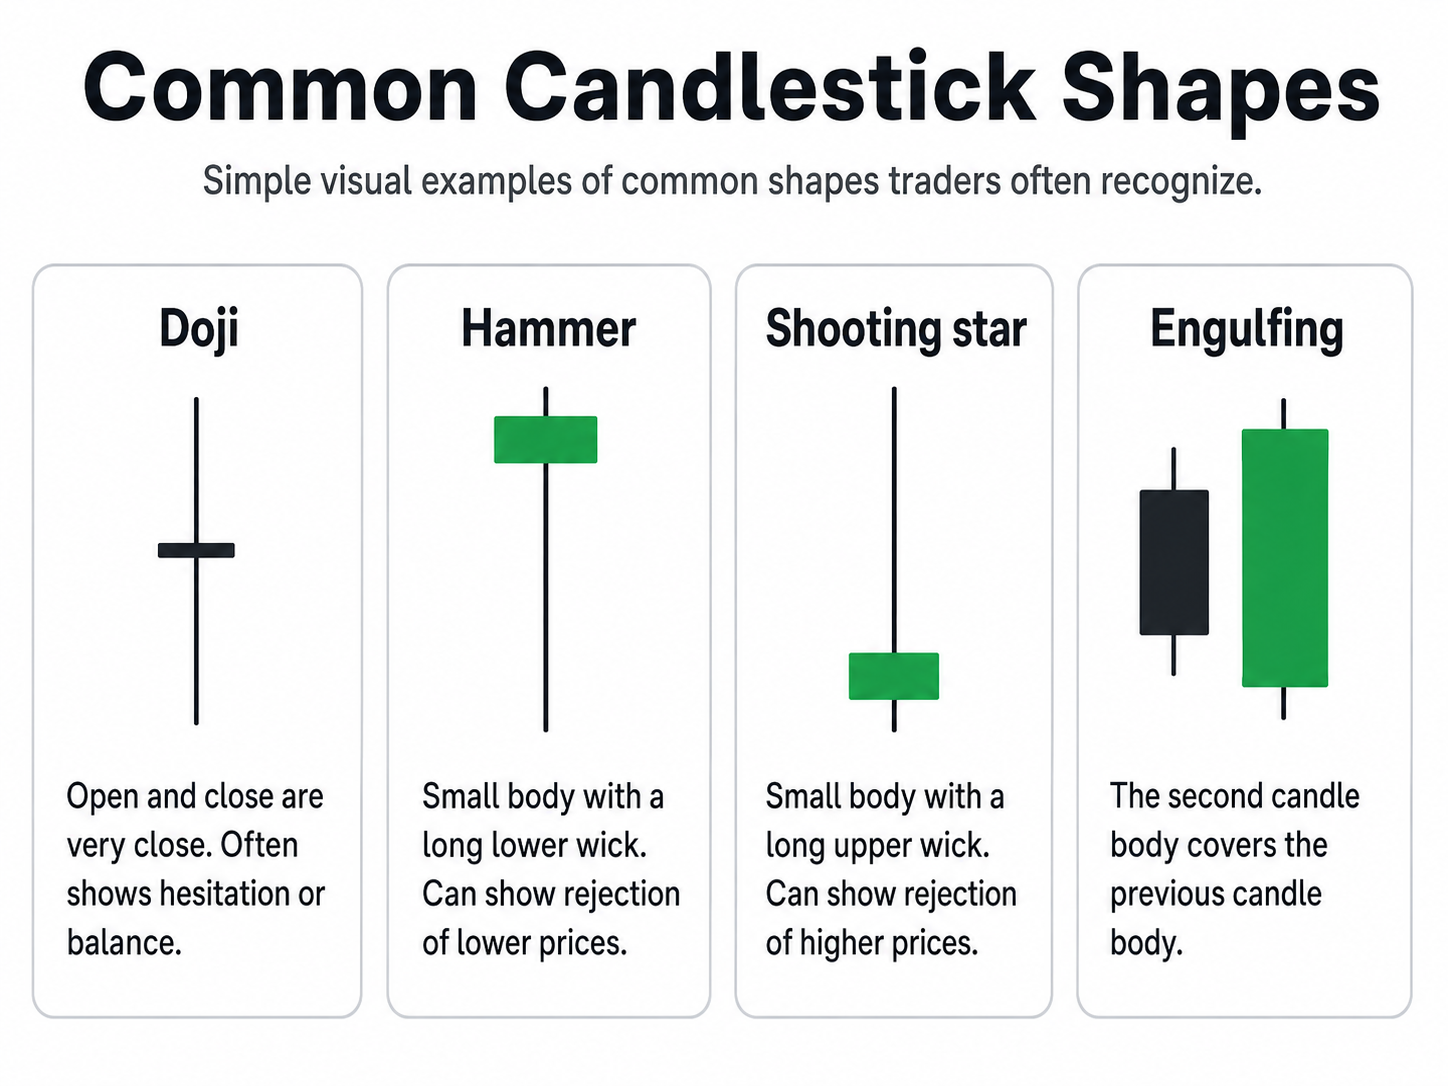
- Small body: open and close were relatively close. This can show hesitation or balance.
- Long upper wick: price traded higher but could not hold those higher levels before the candle closed.
- Long lower wick: price traded lower but recovered before the candle closed.
Doji, hammer, shooting star and engulfing candles
These names are useful because traders recognize them quickly, but they should not be treated as automatic signals.
The pattern name is less important than the question: Where did it happen?
Context matters more than the candle name
The same candle can mean very different things in different places on a chart.
A hammer in the middle of a random sideways range may be ordinary noise. A similar hammer after a controlled decline into a well-tested support area, followed by strong buying, may be more meaningful.
When reading a candle, ask:
- What was the trend before this candle?
- Is price near support, resistance or a breakout level?
- Is volume normal or unusually strong?
- What does the next candle do?
- Is the stock liquid enough to trade efficiently?
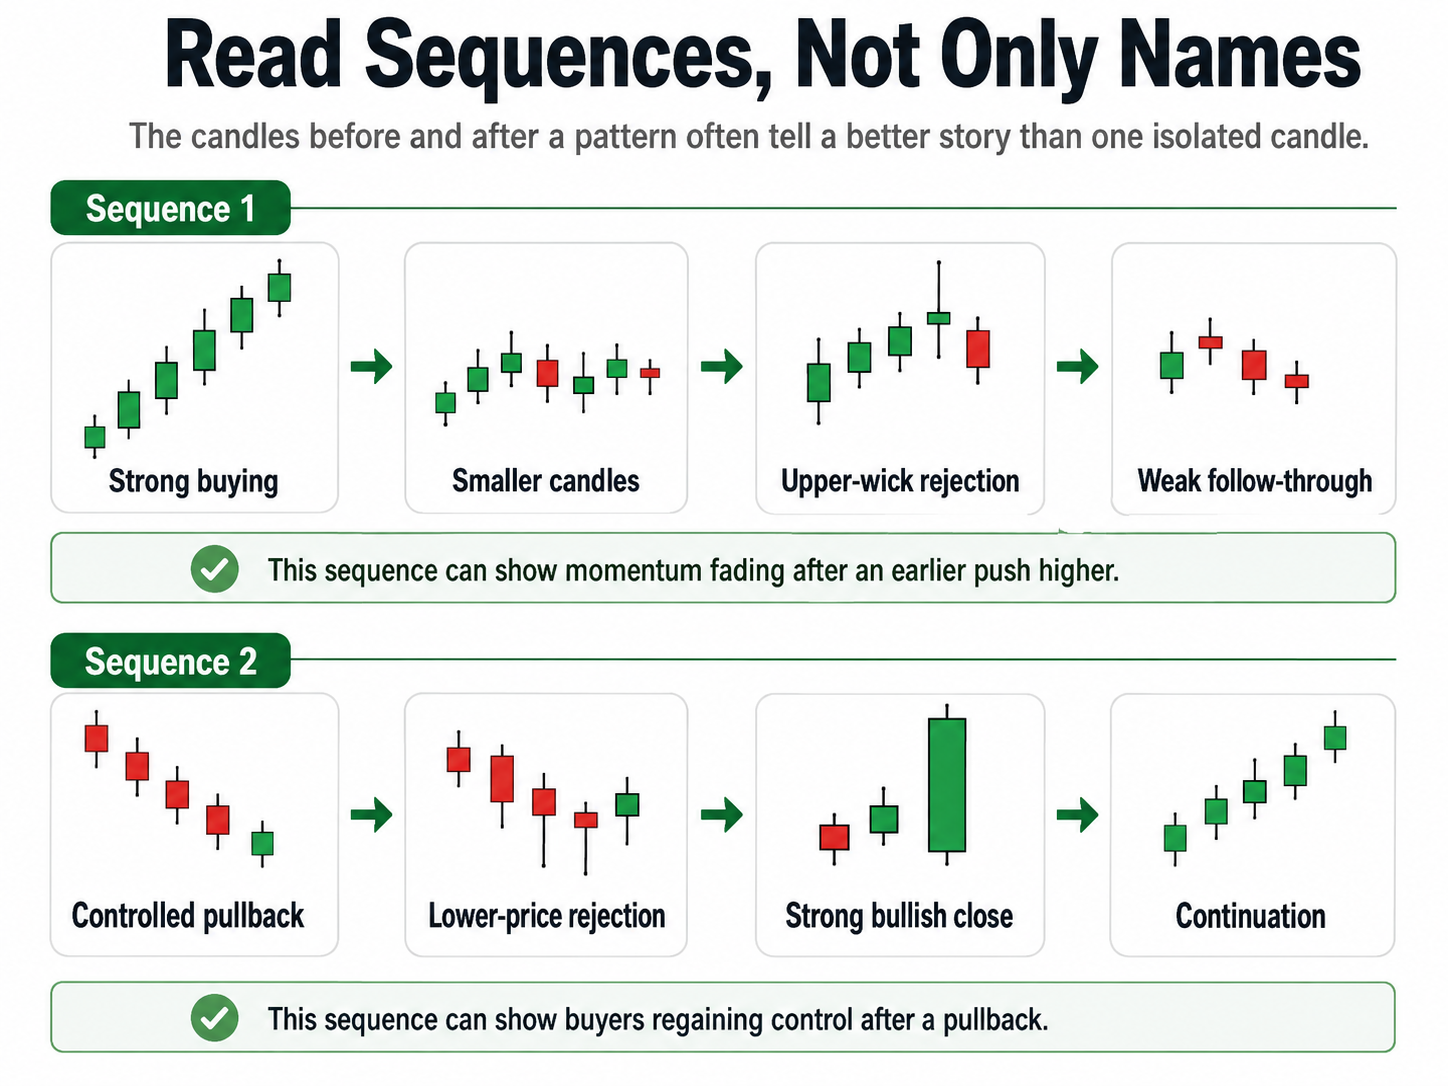
Read sequences, not isolated candles
Experienced chart reading is usually about a sequence of behaviour rather than one perfect candle.
That sequence tells a richer story than simply saying “a shooting star appeared.”
Likewise:
This is the skill we will use later in the StockBayan trading strategy guides.
The timeframe changes the story
A candlestick only makes sense when you know its timeframe.
- 1-minute candle: one minute of trading activity.
- 5-minute candle: five minutes.
- 15-minute candle: fifteen minutes.
- Daily candle: one trading day.
- Weekly candle: one trading week.
A stock may look strongly bullish on a 5-minute chart while still being in a larger daily downtrend. Shorter timeframes contain more market noise and normally require faster decisions.
What not to do
- Do not buy simply because you see a hammer.
- Do not sell simply because you see a shooting star.
- Do not ignore volume, liquidity and the bid-ask spread.
- Do not assume a candle guarantees the next move.
- Do not choose an entry before deciding where the idea is invalid.
Candlesticks are a way of reading price behaviour. They are not a prediction system by themselves.
The simple way to read a candle
If you remember only one thing from this guide, remember this: context is more important than the candle name.